
IoT Concept Design
The Hen House: Remote sensor.
Meaningful Data.
Designing the digital layer for a LoRaWAN-enabled poultry farm in Brandenburg. Translating raw LoRaWAN weight signals from mobile chicken coops into a farmer-first dashboard, so a flock of 1,200 chickens across three sites can be monitored from a single phone, regardless of location.
Role
Lead Designer
Data Experience
Platform
Desktop (manager) +
Mobile (driver)
Deliverables
Concept +
Click Prototype
Industry
AgriTech / IoT /
Smart Farming
Duration
3 Months,
Apr 2024 - Jul 2024
Team

PRODUCT And THE PROBLEM
A farmer with
no visibility
Mobile chicken keeping is exactly that: mobile. Coops rotate across different land parcels (across fruit orchards) to manage soil health, which means the farmer is never in one place and neither are the animals. The challenge this creates is an information gap: how do you manage feed levels, consumption health, and flock wellbeing when you're not physically present?
Part 1 of this project had already answered the hardware question: LoRaWAN weight sensors were installed on each feeder, transmitting readings over 868 MHz LPWAN to a cloud gateway. The data existed. The problem was making it mean something.
Raw feeder weight is not a useful number for a farmer. What they actually need to know is: Are my flocks eating normally? Do I need to reorder feed? Is something wrong with a specific coop? These are the questions this prototype was built to answer.
Coops rotate across land parcels. The farmer can not physically check feeders daily; they are often 30+ minutes away from any given coop.
Weight means nothing
A raw reading of X kg tells a farmer nothing useful without knowing starting weight, flock size, and how it trends over time.
Silent health signals
A flock eating less than expected is often the earliest sign of illness or stress.
Feed ordering is guesswork
Without consumption data, reorder decisions are based on rough weekly estimates, leading to emergency orders or overstocking.
PART 1 - HARDWARE
Feeder weight sensors installed on mobile coops. Data transmitted at 15-min intervals to cloud gateway over 868 MHz LPWAN. Completed onsite before this project began.
PART 2 - THIS PROJECT
Design prototype translating weight signals into feed levels, consumption rates, reorder forecasts, and behavioural alerts. The farmer's window into the hardware.


ROLE AND CONTRIBUTIONS
I was the only designer on this project, working alongside two backend engineers. The engineers handled the sensor data pipeline and cloud infrastructure from Part 1. My domain was everything between the API output and the farmer's thumb. The most consequential part of that work was not the visuals but deciding what to calculate.
Designed two main flows: the sensor onboarding experience (farm profile setup, sensor pairing over 868 MHz, coop assignment, alert preferences) and the dashboard and coop stats views (total flock, feed stock, avg feed per bird, temperature, consumption rate charts, per-coop breakdown). Validated the full concept through a prototype.


DESIGN STRATEGY
Defined the data model: translating raw weight into % fill level, g/bird/day consumption, deviation from baseline, and projected reorder date
Worked alongside engineers to agree on calculation logic, what the backend would expose vs. what needed frontend computation
Defined alert trigger thresholds: when is low feed just low, and when is it an emergency?
Identified that absolute weight was useless without context; decided to always show relative fill % alongside raw weight
UX & PRODUCT DESIGN
Mapped the farmer’s daily routine and information needs; key question: what does he check first thing in the morning?
Designed the full information architecture: Dashboard → Coop Stats → Inventory → Notifications
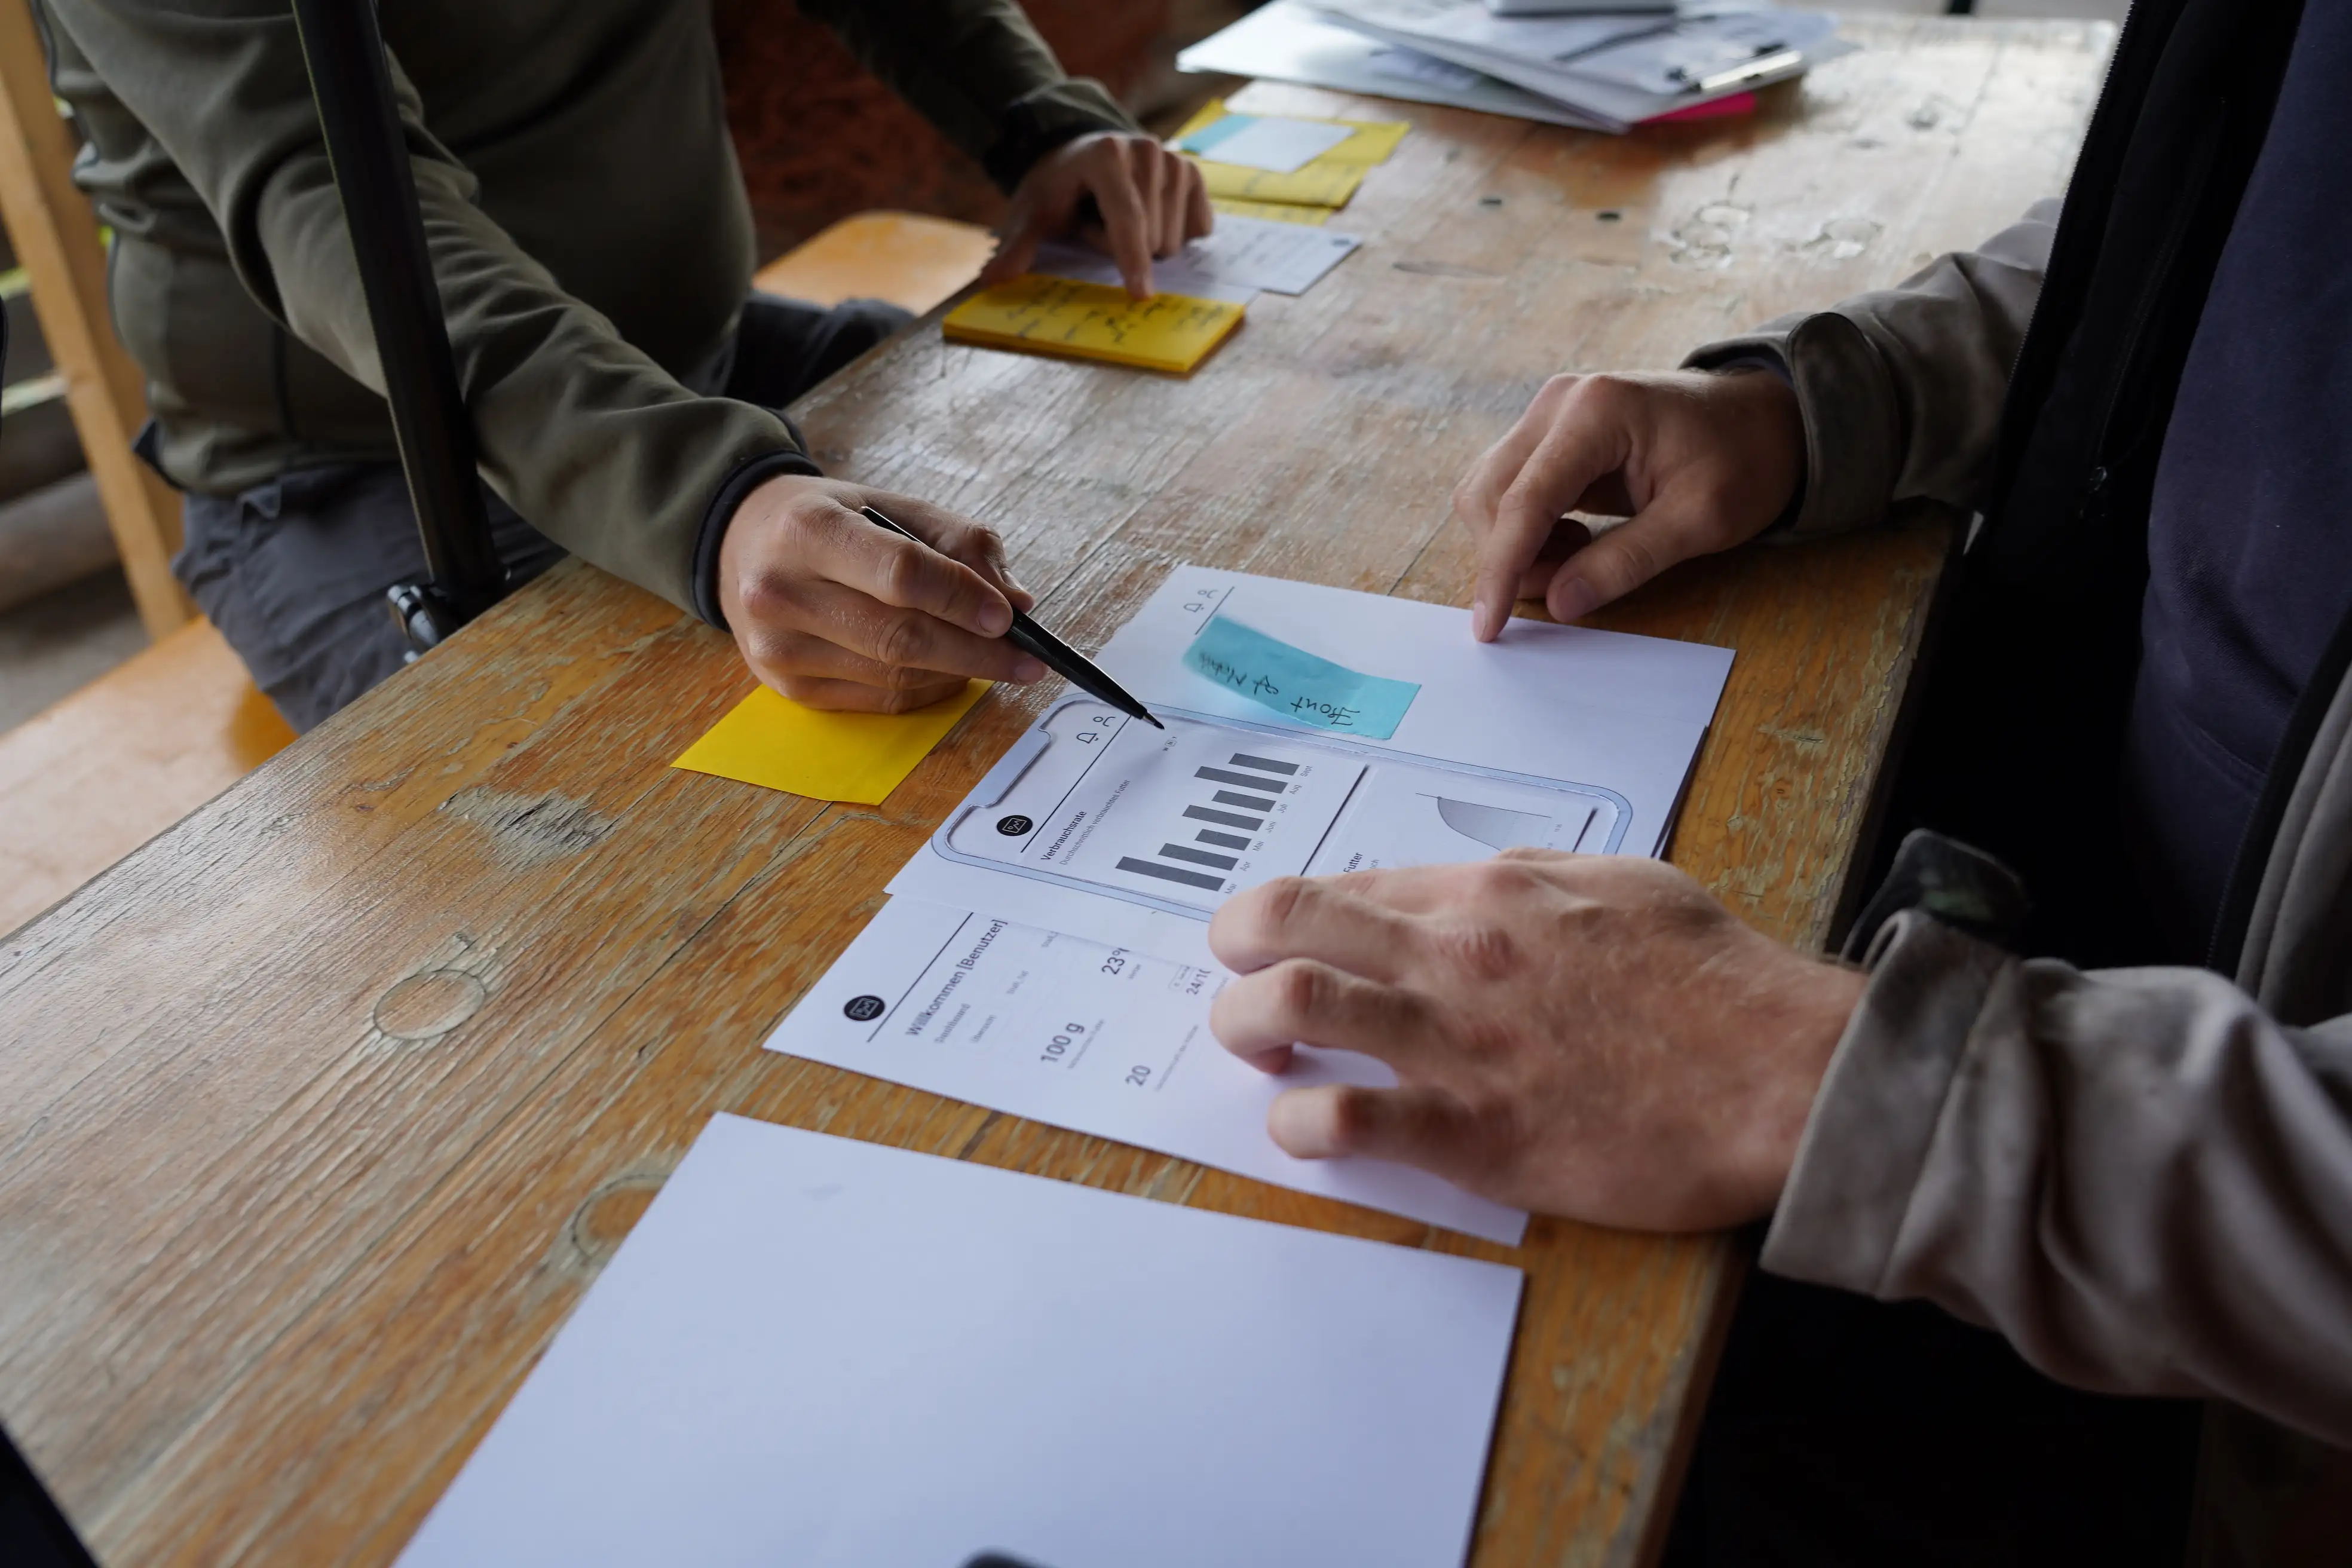
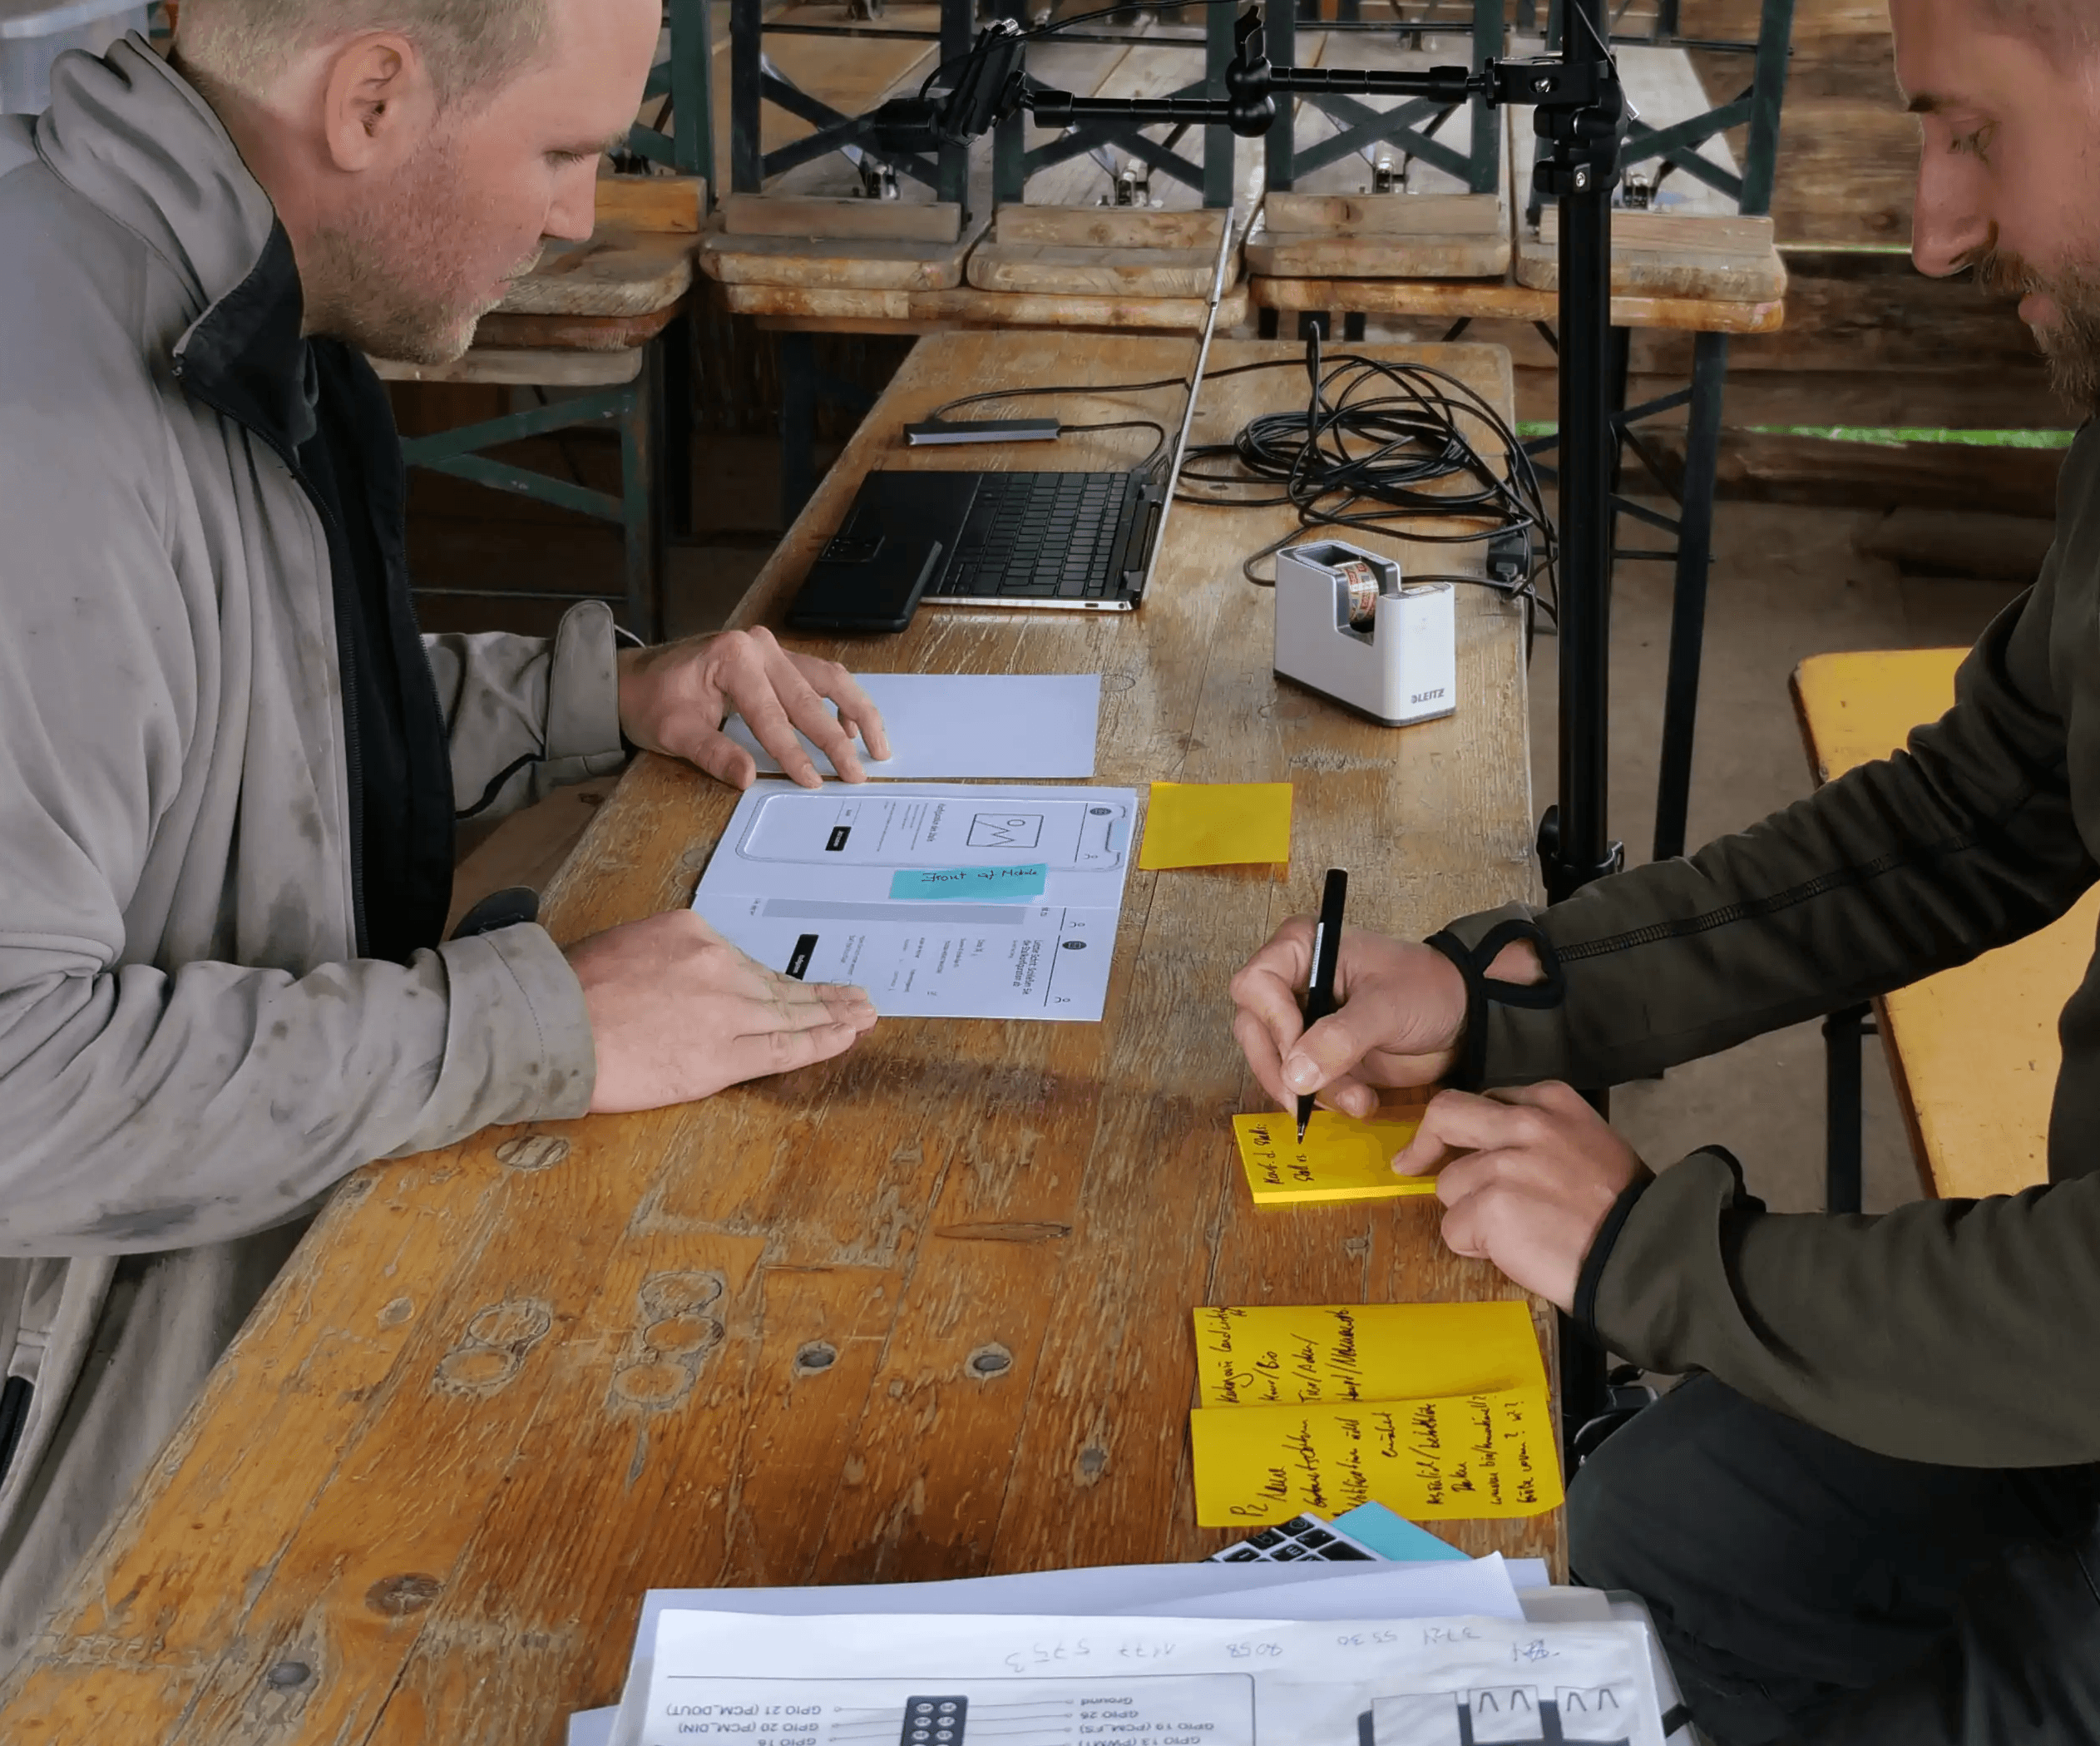
Created paper prototypes for the farmer session, deliberately low-fidelity to encourage honest, unbiased feedback
Ran the paper prototype session, facilitated, observed, and took notes
RESEARCH
Prepared low-fi paper screens representing the core flow
Workshop session: showed screens, asked the farmer to navigate and react verbally
Key finding: the farmer did not need individual feeder detail on the home screen, he needed coop-level status first, then drill-down
Finding: temperature data was assumed to be not useful; he said he did need it. Added from primary view
VISUAL & INTERACTION DESIGN
Designed the bento-grid dashboard, grouping data by urgency and frequency of reference
Created a colour-coded alert system: green (normal), amber (low), red (critical or offline)
Built the full design system, tokens, components, and documented states
Delivered the hi-fi prototype used in open house events and tech showcases


KEY DESIGN DECISIONS
decision 01
Derive, do not just display
Showing raw feeder weight would have been meaningless. The design decision was to calculate metric the farmer actually needed: consumption rate, stock percentage, avg feed per bird, estimated reorder date, from that single signal. What to calculate, and what to surface, was the primary design problem.
decision 02
Onboarding as a trust-builder
The farmer had to physically connect the app to sensors over 868 MHz LoRaWAN. This technical step - farm profile, sensor pairing, coop assignment, alert preferences - was designed as a guided 3-step setup that felt approachable. A farmer confidently completing setup was the first signal that the product was working.
decision 03
Per-coop breakdown, not just farm totals
Farm-level totals hide the variance that actually matters; a low-feed issue in one coop does not show up in a combined average. Designed a dedicated coop stats view so the farmer could drill into each space independently, with its own feed rate, flock size, and feeder status.

OUTCOME
The farmer was very satisfied with the prototype. He contracted a development agency to realise the application; the hi-fi prototype served as the direct specification for that engagement.
The prototype was also showcased at four open house events and a series of networking tech events, especially ones focused on agritech and smart farming. It was well received, not just as a concept but as a concrete, working demonstration of what LoRaWAN sensor infrastructure could enable beyond industrial applications.
12 of 26 attendees at one open house event wanted to try the prototype themselves, and expressed interest in learning more about how the hardware and platform worked end-to-end. Several asked about availability and timeline for a public version.
3
3
3
3
6
6
6
%
%
%
Open House attendees expressed a direct interest in testing the prototype
0
0
0
0
9
9
9
+
+
+
Attendees from each event reached out to inquire about similar custom automation projects.
0
0
0
0
6
6
6
+
+
+
Public technology showcase events where the prototype generated traffic to digital bridge platform.


